Items used in this project
Hardware components
Arduino Uno - R3Software apps and online services
Hand tools and fabrication machines
Story
A system for mobile real-time air pollution monitoring system has been developed. This system is being developed with an aim to monitor pollution in real-time. This system uses low-cost air quality monitoring sensors with GPS and GSM/GPRS modules or Bluetooth mesh network. The concentration of various gases will be measured using the semiconductor sensors and location of that concentration using GPS module. This concentration will be measured at various locations at a real time scale. Sensors after gathering data will send data to a database using GPRS/Bluetooth module along with the location obtained. Fundamental aspect of above work is to provide a real-time dynamic pollution measurement system.
As we witness growth of technology, we can sense both sides of it. With advent of industrial age, onset of massive production and over-exploitation of precious resources, pollution is today one of the most highly debated issue. Prior to controlling anything it is important to measure it and considering this, Inventors explored the measurement techniques and as we can see now many such techniques are available. But a close study of sources of pollution and the pattern in which it is present it comes to view that techniques available today are not enough. All the prevailing techniques are static, their sensors are implanted at a single place and from there they measure the pollution of an area. So, there is a lack of real-time and location-specific pollution monitoring techniques. Considering all these limitations we designed a system which can be implanted in any modes of transportation (municipality buses, state transport) which has a vast network and are accessible to almost every area. Then the data along with the latitude and longitude collected by the system is then being sent to the website and online database with the help of GPRS module. Inventers felicitate the existing air pollution measurement system and designed a better and more reliable air pollution measure system that can be both real-time and location-specific.
Here I have implemented 2 case study with there prototype and compared the results :
(1) Using direct GPRS module for transmitting data and
(2) Using Bluetooth mesh network for the same
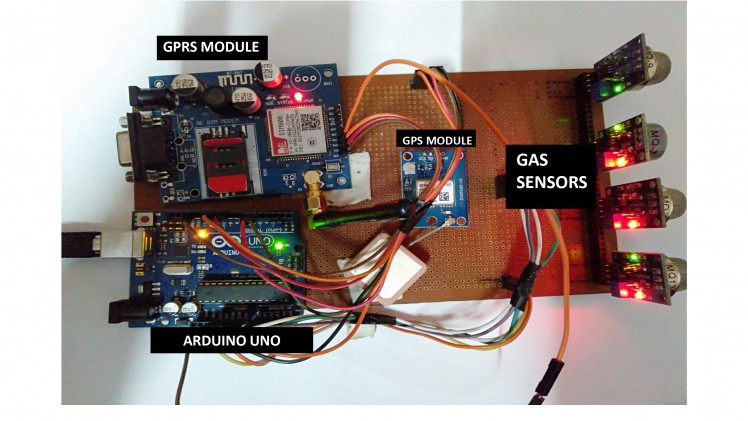
CASE STUDY 1 : Using GPRS module
propose a Mobile pollution parameter monitoring system based on GPS receiver and GPRS module.
The proposed system consists of
Mobile sensors (GPS-GPRS system, sensor network, development board etc.)
Communication channel
Base station
Data processing centre
Users.
Users can be anyone who want to access the website either for informative purpose or for research and analytics.
1. Users
This is just an extension of the previous point where the data is processed. Here the data that is processed is continuously tested and is synchronous with the remote non- static and static sensing units. As both the non-static and static sensing units will contribute to the effective calculation of air pollution measurement and its index (AQI/AQHI) and in our case the HAQHI, the system requires rapid real-time functioning to avoid delays and/or glitches.
2. Website/Application on the server:
processed end data is fed to the user presentable platforms which could be anything feasible like an Android App or a Website.
The Data Processing Centre is the next crucial part of the project block diagram after the data is received and acquired in a presentable format that is understandable by a human. The Data Processing Centre then carries out certain pre-decided explainable mathematical functions using the data that is available and in turn provides meaningful data from the raw data input using the mathematical models designed through the research development taking place in AQI and AQHI measurement techniques. Finally, the
3. The Data Processing Centre:
Data Acquisition Data Processing Data Manipulation Base Station – Website/Android App Link Maintenance
The Base Station can be anything from just a virtual cloud platform to a physical network point corresponding to a geographical location. It is a place where the core processes after collecting the useful data is carried out. The Base Station contains the following operating tasks:
Grounded Cable Networks RF Transmission links
4. The Base Station:
Satellite links
The Communication Channel forms the underlying link between the transmitting and receiving end. The transmitting end is connected to the receiving end through one or more routes which includes the following
5. The Communication Channel:
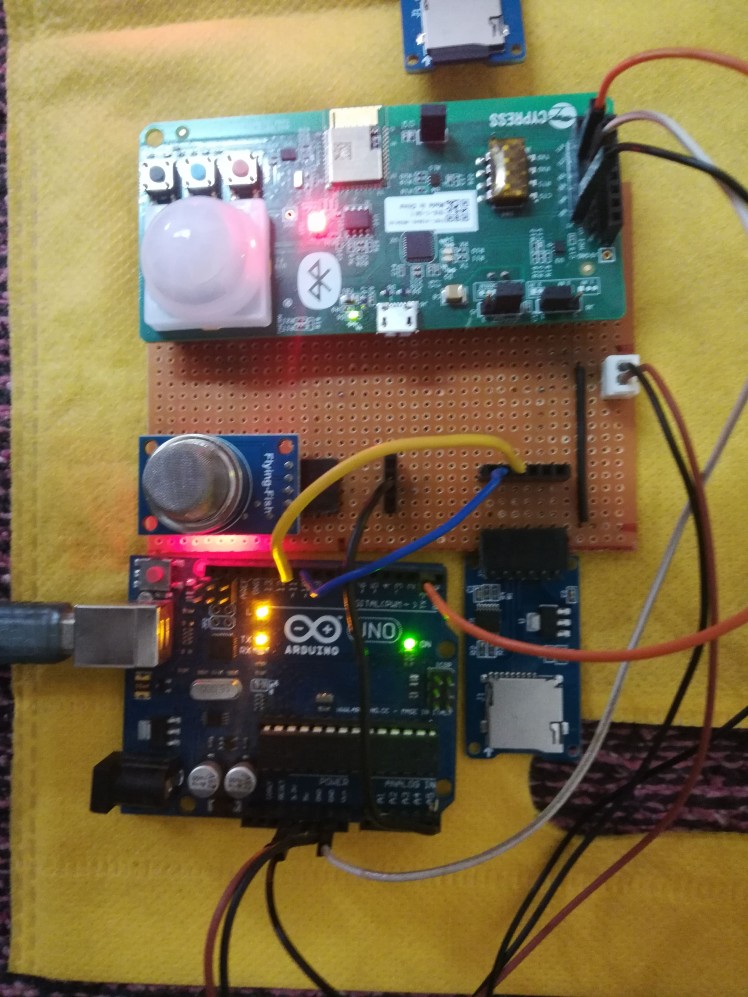
The Sensors form the quintessential part of the part of project. It involves the remote non-static sensor networks formed by the collective contribution of the gas sensors, the GPS-GSM Module, the microcontroller and the hardware associated with it in rendering its services. Whole collective system of different sensors are implanted on public transport such as bus etc.This collective piece of hardware & software integration takes us to the next stage where the data whatsoever collected at these remote sensing units is transmitted to the base station through the Communication Channel.
6. The Sensors:
The block diagram of an implementation of the proposed system is as shown in the Fig. 1
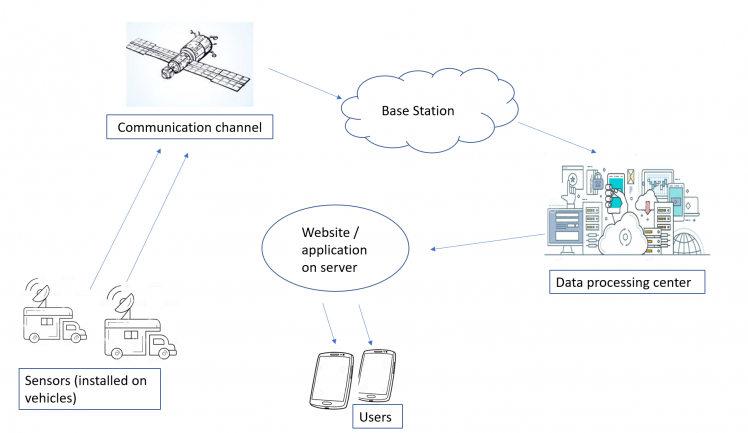
[Fig. 1] Implemented System :
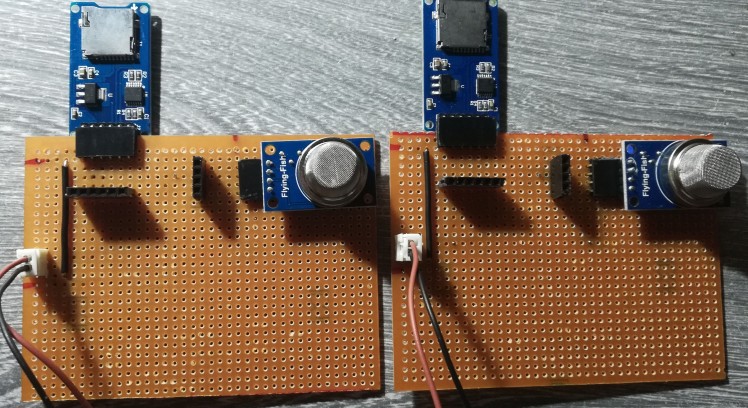
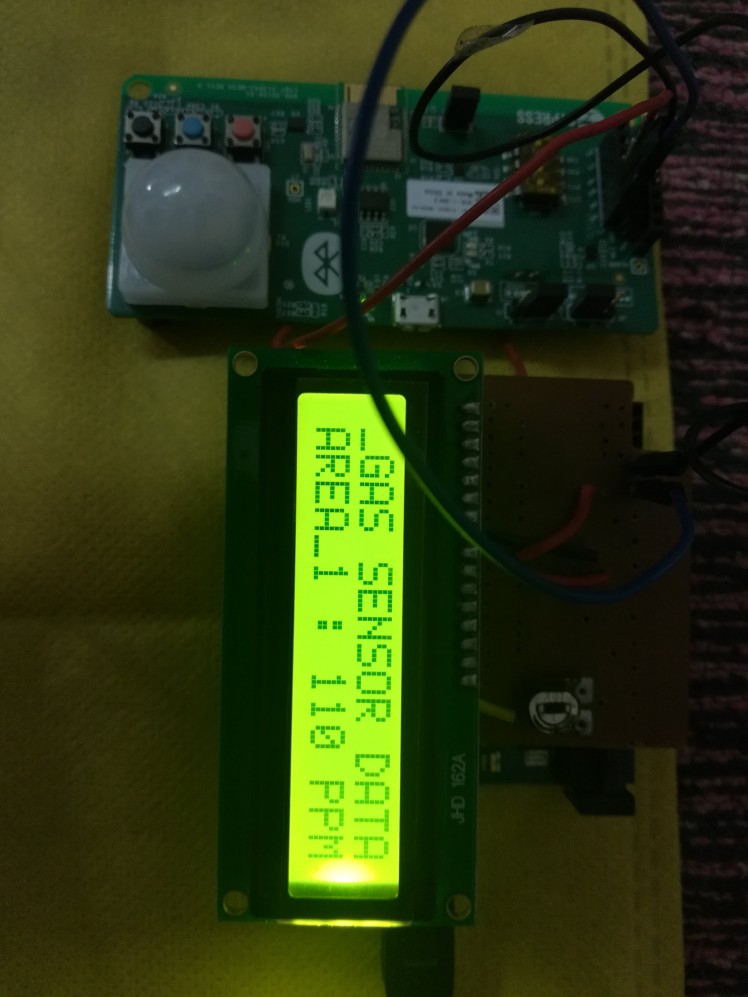
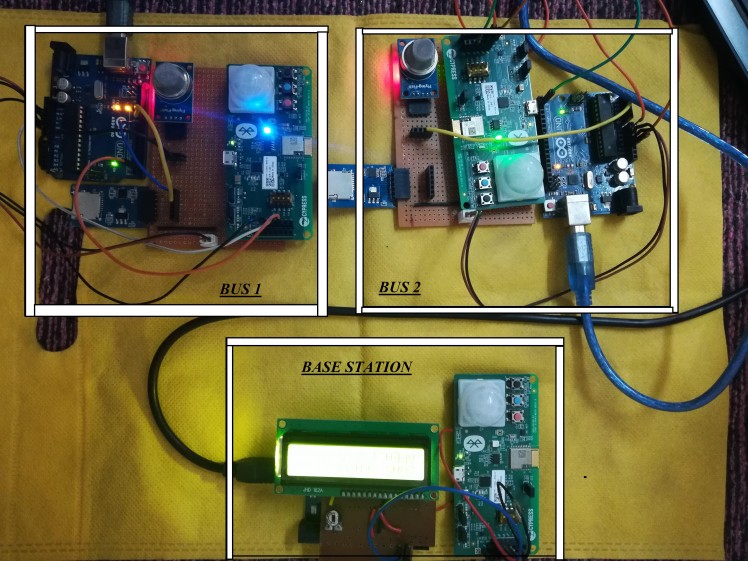
CASE STUDY 2 : Using Bluetooth mesh network
Story of this project using Bluetooth module with study about module and its feature from www.cypress.com/ble-mesh and with the help of cypress community.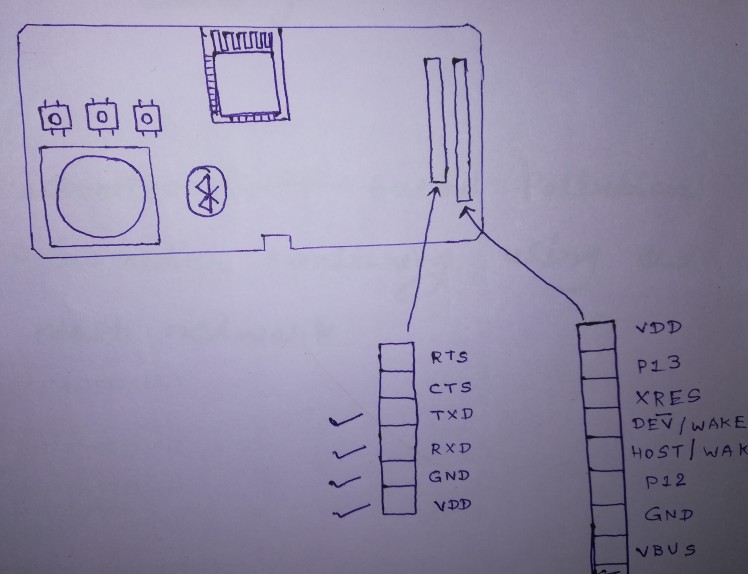
After gathering all information about module then i connect the module with laptop via USB and started with the Software MODUS TOOLBOX 1.1 & WICED SMART.
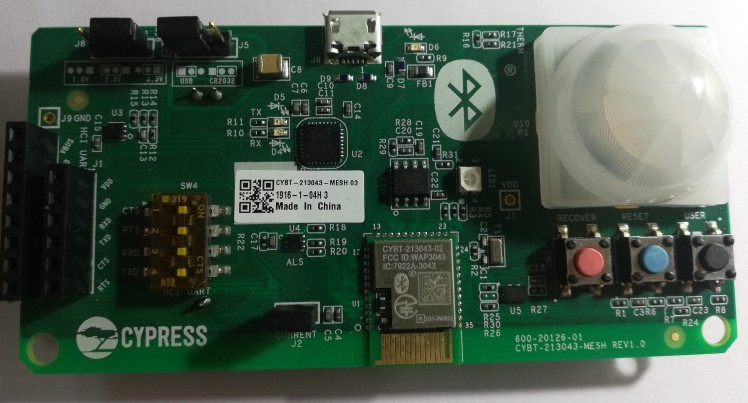
After referring the getting started file from Cypress (i will include that in zip file) i will be able to connect all the BLE modules with each other. Then performed information transfer and max range finding experiments.
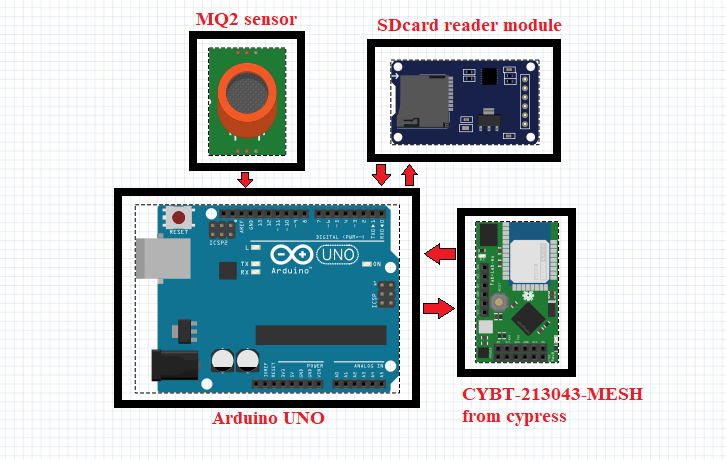
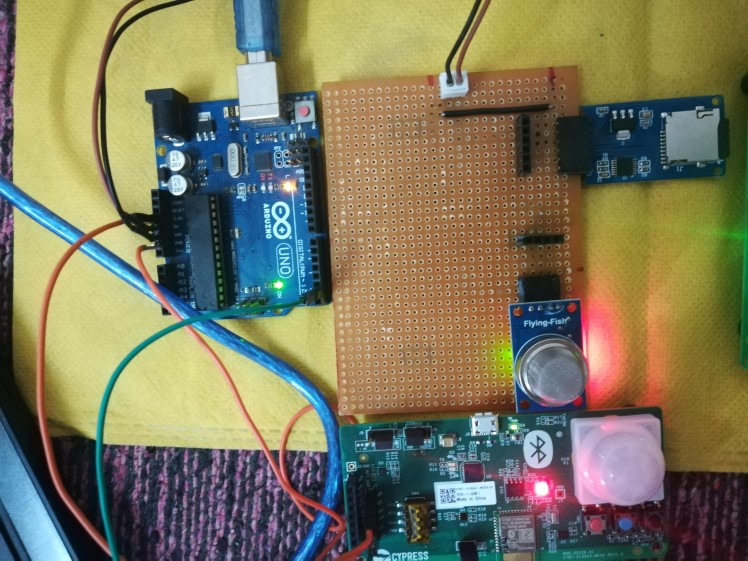
Finally i will be able transfer data using one Arduino to second via ble devices and developed this schematic as shown in Fig.2

Connection details :
Arduino pin : device pin
A0 : data pin(MQ2 SENSOR)
11 : MOSI (SDcard reader module)
12 : MISO (SDcard reader module)
13 : CLK (SDcard reader module)
ble module is connected as data required as if we want to transmit data then connect TX to RX and if sending then vise versa.
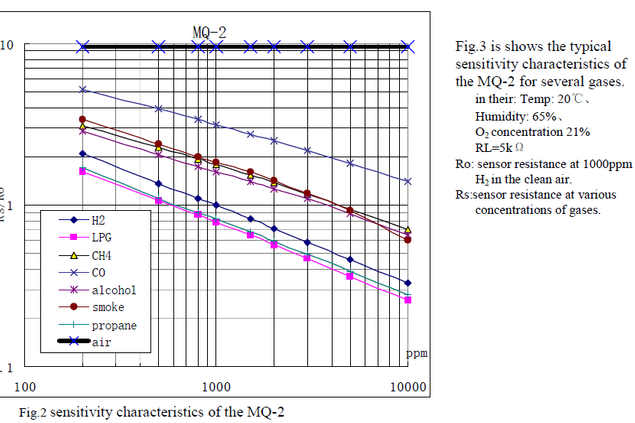
Formula In the Coding
pow(10,( ((log(rs_ro_ratio)-pcurve[1])/pcurve[2]) + pcurve[0]))
Based on the graph MQ2, the derivation of ppm formula will be:
Y - y1 = m( X - x1)
X= (y-y1)/m + x1
X= (Rs/Ro-y1)/m + x1
log X =(log (Rs/Ro) - y1)/m +x1
X =10^( (log (Rs/Ro) - y1)/m +x1)
*Note: X = ppm on the graph
Y= Rs/Ro
assume the this modules are installed in public transport along with there location specific IDs and then whenever this vehicle/bus are crossing the 4 cross road or stopped at that time it will transfer all the data with there timing (which are stored in SD card/storage of mobile device) to near by base station where we have constant internet connectivity (already is there right now) and that data will be transferred on internet for further analysis and predictions.
case 1 : Why this mesh network is better than inbuilt GPRS module ?
GPRS can not able send the all data due to NETWORK connectivity of SIMCARD or due to weather reasons.

Schematics and circuit diagrams
Transmitter